
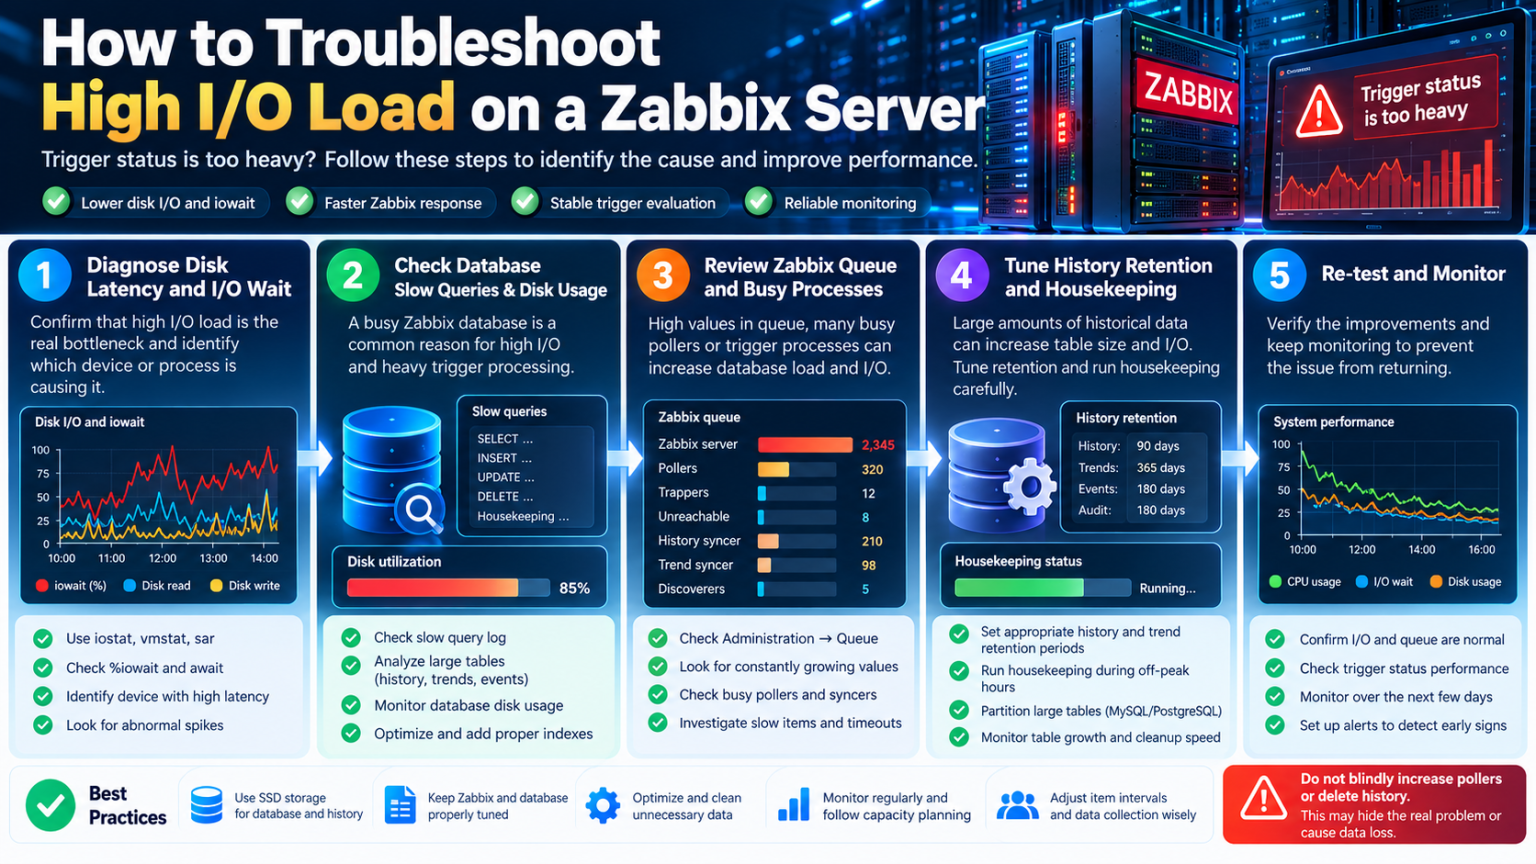
I/O Load on the Zabbix Server Is Too Heavy: How to Diagnose and Fix It
If you use Zabbix to monitor servers, network devices, databases, or applications, you may encounter a warning such as “I/O load on the Zabbix server is too heavy.”
This alert indicates a potential performance problem that deserves investigation. High input/output (I/O) activity can make database queries slower, delay monitoring updates, increase trigger-processing time, and affect the overall responsiveness of your monitoring system.
However, the solution is not always to add more CPU cores, increase RAM, or install additional pollers. The actual bottleneck may be slow storage, database queries, excessive monitoring frequency, a growing history database, or a housekeeping process that cannot keep up with the workload.
In this guide, we will explain what the alert means, how to identify its cause, and how to improve Zabbix performance without unnecessarily changing a working configuration.
What Does “I/O Load on the Zabbix Server Is Too Heavy” Mean?
Input/output refers to the movement of data between a computer’s memory, storage devices, and other components. In a Zabbix installation, storage I/O is particularly important because the system continuously collects monitoring values and stores historical information.
A typical Zabbix deployment contains three main components:
- Zabbix server: Collects and processes monitoring data, evaluates triggers, and manages alerts.
- Database: Stores configuration, history, trends, events, and other information.
- Frontend: Displays dashboards, graphs, problems, and configuration settings.
The Zabbix server and frontend both interact with the database, making database performance an important part of the overall system. See the official Zabbix server documentation.
When storage or database operations become a bottleneck, you may observe:
- High disk utilisation or I/O wait.
- Slow database queries.
- Delays in processing incoming monitoring values.
- Growing monitoring queues.
- Slow dashboards and graphs.
- Delayed trigger evaluation or notifications.
- High database disk activity during history cleanup.
Important: The exact meaning of the trigger depends on the Zabbix version, template, and trigger expression being used. Check the trigger’s expression and the underlying item before assuming that disk utilisation alone is responsible.
1. Check Whether Disk I/O Is Actually the Bottleneck
Start by checking the operating system rather than immediately changing Zabbix configuration.
On a Linux Zabbix server, install the sysstat package if the required monitoring tools are not already available.
For Ubuntu or Debian:
sudo apt update
sudo apt install sysstat
Check disk activity using iostat
Run:
iostat -xz 1 10This displays extended disk statistics every second for ten reports.
Pay attention to these fields:
| Metric | What it tells you |
|---|---|
r/s and w/s |
Read and write operations per second |
rMB/s and wMB/s |
Read and write throughput |
await |
Average time for I/O requests to complete, including queueing |
aqu-sz |
Average number of outstanding I/O requests |
%util |
Time the device was busy handling I/O |
The exact fields available depend on the version of sysstat.
High %util, long await, and a growing queue can indicate a storage bottleneck, particularly when they coincide with poor application performance. However, utilisation alone does not prove a problem: SSDs, RAID arrays, virtual disks, and NVMe devices behave differently.
Check CPU I/O wait
Run:
vmstat 1 10Look at the wa column. It represents the percentage of CPU time spent waiting for I/O.
If I/O wait remains high while disk latency and Zabbix response times increase, storage may be limiting performance.
You can also check:
topFor a broader view of process-level I/O, use:
sudo iotop -oPaThis command requires iotop and appropriate permissions. It may not be available or fully informative in every virtualised environment.
What to do next: Identify which device contains the database files and check whether that device is responsible for the observed latency. A busy disk that does not host Zabbix’s database may not be the cause.
2. Investigate the Database
The database is often a major contributor to I/O load in Zabbix installations because monitoring data is written continuously.
The database may be MySQL, MariaDB, PostgreSQL, or another supported configuration, depending on your installation and Zabbix version.
Check database resource usage
For a MySQL or MariaDB installation, start with:
sudo mysqladmin processlistThis provides a snapshot of active database processes and queries.
For a more detailed view, connect to the database and inspect its activity:
SHOW FULL PROCESSLIST;Look for queries that run for a long time, repeated expensive operations, or sessions waiting on locks.
Next, review database logs and performance metrics to determine whether slow queries, table scans, or disk pressure are occurring.
Enable slow-query logging carefully
Slow-query logging can help identify expensive operations. On MySQL and MariaDB, the configuration and exact options depend on the installed version.
For example, a temporary diagnostic configuration may include:
slow_query_log = ON
long_query_time = 2
The value 2 is an example threshold in seconds, not a universal recommendation. Choose a suitable threshold for your workload, ensure the log has adequate disk space, and follow the database vendor’s documentation before applying configuration changes.
Official references:
Do not enable every form of database debugging indefinitely on a production server. Logging can generate additional I/O and consume storage.
Optimise the database before adding more processes
Check whether the database has sufficient memory, suitable indexes, and appropriate storage. Review database-specific tuning guidance for your version and workload.
Zabbix depends heavily on database availability and performance, as described in its performance and configuration documentation.
3. Review Zabbix History and Trend Data
Zabbix stores historical monitoring values so that you can investigate problems and display graphs over time.
In a large deployment, frequent collection from hundreds or thousands of hosts can generate substantial database activity. Keeping excessive history for every item can also increase storage requirements and maintenance overhead.
Review retention settings
Open the Zabbix frontend and navigate to:
Administration → Housekeeping
The exact menu location can vary by version.
Review how long Zabbix retains:
- Numeric and text history.
- Trends.
- Events and alerts.
- Other supported housekeeping data.
Do not reduce retention blindly. Decide how much history your operational, reporting, auditing, and troubleshooting requirements actually need.
For example, an organisation may need detailed history for a relatively short period and longer-term trends for capacity planning. The correct retention periods depend on those requirements.
The official Zabbix housekeeping documentation explains how retention and automatic cleanup work.
Why housekeeping matters
Housekeeping removes expired data and certain records left behind by deleted objects. If the database has accumulated substantial historical data, cleanup itself can create considerable database activity.
Reducing retention is not necessarily an instant fix. Existing records may take time to remove, and the cleanup process has limits designed to prevent excessive deletion in a single cycle.
Best practice: Choose appropriate retention periods, monitor the rate of database growth, and perform major cleanup or database maintenance with a recovery plan.
4. Reduce Unnecessary Monitoring Activity
A common source of avoidable database load is collecting data more frequently than necessary.
For example, monitoring a rarely changing configuration value every five seconds may generate more data than the operational requirement justifies.
Review your Zabbix items and templates to identify:
- Very short update intervals.
- Duplicate monitoring items.
- Unnecessary log or text collection.
- Expensive custom scripts.
- Excessive discovery frequency.
- Items that collect data no one uses.
Set sensible update intervals
Different metrics need different collection frequencies.
| Monitoring requirement | Possible approach |
|---|---|
| Critical service availability | Frequent checks appropriate to the required response time |
| CPU and memory utilisation | A moderate interval suitable for capacity and alerting needs |
| Slow-changing inventory | Less frequent collection |
| Historical capacity planning | Collect only the detail needed for useful trends |
These are general examples, not fixed intervals for every deployment.
Use Zabbix’s own performance measurements to determine whether collection frequency is creating a bottleneck. Avoid reducing critical monitoring frequency simply to make an alert disappear.
Avoid unnecessary duplicate checks
If multiple items collect the same information independently, investigate whether the configuration can be simplified.
A smaller, more purposeful set of checks can reduce database writes, preprocessing work, and network traffic while preserving useful visibility.
5. Check Zabbix Queues and Busy Processes
High I/O load can be accompanied by a growing queue, but a queue problem is not automatically a storage problem.
Open the Zabbix frontend and review the queue and server process statistics available in your version.
Look for:
- Items waiting longer than expected.
- Persistently busy pollers.
- High preprocessing activity.
- Delayed history synchronisation.
- Database-related delays.
- Repeated timeouts or unreachable hosts.
You can also examine internal Zabbix metrics. For example, the internal item zabbix[queue] can help reveal monitoring items that are waiting to be processed.
The Zabbix server documentation describes server processes and their roles.
Should you increase the number of pollers?
Not automatically.
Increasing poller counts can help when polling capacity is genuinely insufficient. However, additional processes may increase concurrent requests and database connections, potentially making a database or storage bottleneck worse.
Before changing process counts:
- Identify which process type is overloaded.
- Check whether the workload is CPU-bound, network-bound, or waiting on the database.
- Review queue trends rather than a single snapshot.
- Change one relevant setting at a time.
- Measure the result after the change.
The objective is to balance workload, not to maximise the number of running processes.
6. Review Zabbix Server Configuration and Caches
Zabbix has configuration parameters that influence caches, workers, and housekeeping.
Relevant parameters include:
CacheSizeHistoryCacheSizeHistoryIndexCacheSizeStartPollersStartPreprocessorsHousekeepingFrequencyLogSlowQueries
Their availability and defaults depend on the Zabbix version.
The Zabbix server configuration reference documents these settings.
Increase caches only when needed
Caches can reduce some database access and improve processing efficiency, but increasing them without checking memory use is not a reliable fix.
Inspect Zabbix internal metrics and logs for evidence of cache pressure. If a cache is consistently near capacity or the server reports related warnings, consider a measured adjustment.
Use slow-query logging for diagnosis
The LogSlowQueries server parameter can help identify slow database queries generated by Zabbix. It is a diagnostic aid rather than a direct I/O optimisation.
Enable it for an appropriate period, review the findings, and avoid unnecessary long-term verbose logging.
Always back up configuration files and test changes carefully. Parameter names, supported ranges, and defaults can change between releases.
7. Consider Faster Storage for the Database
If measurements confirm that storage latency is the limiting factor, the underlying storage configuration may need improvement.
Potential options include:
- Moving database files to suitable SSD or NVMe storage.
- Providing sufficient IOPS and throughput in a virtualised environment.
- Reviewing storage-controller or hypervisor contention.
- Separating database workloads from unrelated heavy I/O where practical.
- Ensuring the filesystem and storage configuration suit the database workload.
However, faster storage is not a substitute for identifying the bottleneck. A poorly tuned database can remain inefficient even on a fast SSD.
For virtual machines, check the storage performance limits imposed by the host, cloud provider, or virtual disk configuration. The physical device’s advertised speed may not reflect the performance available to your VM.
8. Use Partitioning and Database Maintenance Where Appropriate
For larger Zabbix installations, database maintenance strategies can become important.
Depending on the database engine and Zabbix version, options may include:
- Appropriate indexing and query optimisation.
- Database-specific maintenance.
- Partitioning large history and trend tables.
- Supported time-series storage or compression features.
- Better capacity planning for database growth.
Partitioning is not a universal quick fix. It requires careful design, compatibility checks, and a maintenance strategy.
For TimescaleDB installations, consult the Zabbix documentation for supported history and trend compression or housekeeping options. For MySQL, MariaDB, and PostgreSQL, follow the database-specific guidance for the exact version in use.
Never run an untested database schema change or manually delete Zabbix history tables on a production system simply to reduce I/O.
9. Monitor the Results After Each Change
Once you have made an adjustment, compare performance before and after the change.
Track:
- Disk latency and I/O wait.
- Database response times.
- Database disk utilisation.
- Zabbix queue length.
- Busy-process percentages.
- History synchronisation performance.
- Trigger evaluation and notification delays.
- The original trigger’s status.
Use a consistent comparison period and consider normal workload variation.
If the alert returns, investigate whether the underlying workload has grown, the database is still constrained, or the original trigger is measuring a different condition than expected.
Do not disable the trigger simply because it is inconvenient. First establish what it measures and whether it is accurately reflecting a real problem.
Quick Troubleshooting Checklist
Use this checklist to structure the investigation.
-
Confirm the trigger expression and identify the metric that caused the alert.
-
Run
iostat -xz 1 10and inspect disk latency and queueing. -
Check CPU I/O wait with
vmstat 1 10. -
Identify the device hosting the Zabbix database.
-
Inspect database activity and slow queries.
-
Review history and trend retention settings.
-
Identify excessive or duplicate monitoring items.
-
Check Zabbix queues and busy processes.
-
Adjust configuration only when measurements justify it.
-
Compare results and confirm that monitoring remains healthy.
Conclusion
The Zabbix warning “I/O load on the Zabbix server is too heavy” should be treated as a diagnostic starting point, not a reason to change every performance setting.
Start by checking disk latency and I/O wait. Then investigate database activity, historical data growth, monitoring frequency, housekeeping, and overloaded Zabbix processes.
If storage is the bottleneck, improve the storage configuration. If the database is overloaded, address queries and workload. If too much data is being collected or retained, make targeted adjustments that preserve the monitoring information you need.
The best solution is the one that removes the actual bottleneck while keeping Zabbix reliable and your monitoring data intact.
Frequently Asked Questions
What causes high I/O load on a Zabbix server?
Common causes include slow storage, heavy database activity, frequent item collection, large history tables, housekeeping work, and excessive concurrent processing.
Will adding more RAM fix high I/O load?
It may help if memory pressure or insufficient database caching is contributing to the problem. It will not necessarily fix slow storage or expensive queries.
Should I increase Zabbix pollers?
Only if monitoring data shows that polling capacity is insufficient. Additional pollers can increase database activity and make an existing bottleneck worse.
Can I delete Zabbix history data to reduce I/O?
Use supported retention and housekeeping settings. Avoid manually deleting database records or tables without a tested, version-appropriate procedure and a verified backup.
How can I identify the exact cause?
Start with disk statistics, database activity, Zabbix queues, server logs, and the trigger expression. Compare these measurements during normal and degraded periods.